What Standard Bloodwork Misses in Perimenopause
Standard tests catch disease but miss the hormone swings that define perimenopause.
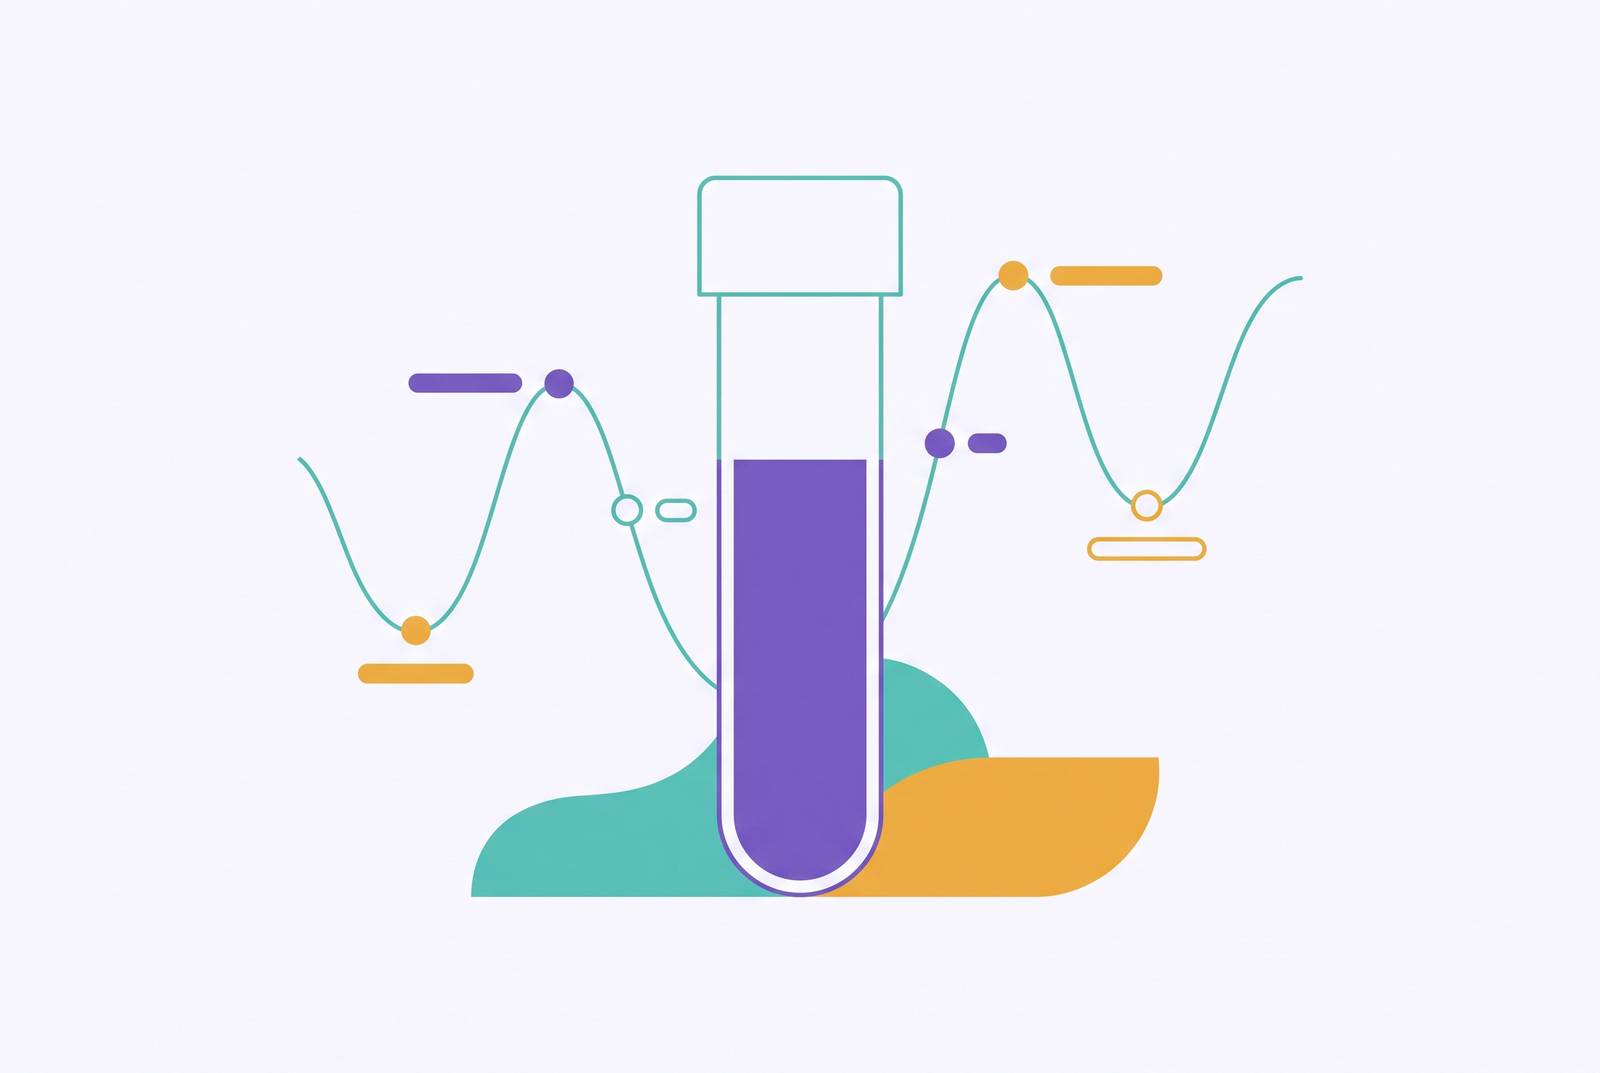
Standard bloodwork is built to catch disease, and it does that job well. What it was never built to do is track a slow-moving hormonal transition that can stretch across a decade, which is exactly why so many women in perimenopause get a "normal" panel back while feeling nothing close to normal.
That gap is not a mistake anyone made. It is a design mismatch, and understanding it changes how a woman reads her own results.
What the hormonal environment of perimenopause looks like
Estrogen does not taper off gently. During perimenopause it can spike well above premenopausal levels, then fall sharply, sometimes within the span of a single cycle. A woman drawing blood on a Tuesday might see a number that looks nothing like what she'd get from the same vein two weeks later. That volatility alone should raise questions about what one blood draw can actually tell anyone.
Progesterone usually goes first. It depends entirely on ovulation, and ovulation starts getting inconsistent early in the transition, often years before estrogen shows any real decline. So a woman can have high or "normal" estrogen on paper and still feel dreadful, because she isn't ovulating consistently and her progesterone has quietly dropped out of the picture. Labs rarely catch this because they're not looking for it; they're looking for pathology, and an estrogen level within range doesn't register as one.
FSH tells a related but separate story. As the ovaries become less responsive, the pituitary gland cranks up FSH production trying to force the issue. But that rise is erratic during perimenopause, not a steady climb. AMH, meanwhile, declines more consistently across the transition, which makes it one of the more trustworthy long-range indicators of ovarian reserve. It almost never appears on a standard panel.
The research community has more or less conceded the point about single measurements. The STRAW+10 framework, revised in 2012, stages reproductive aging primarily off menstrual cycle characteristics, cycle-length variation of seven or more days marks early perimenopause, gaps of over two months mark late perimenopause, and treats hormone values as supportive evidence at best, not definitive markers. That serves as a tell. If the framework built to stage this transition leans on cycle history over hormone snapshots, it's because the snapshots don't hold up on their own.
The specific markers standard panels order, and what each one fails to show in this context
FSH is usually the headline marker on a perimenopause workup, and a single reading is genuinely hard to interpret. An FSH above 30 IU/L tracks with established menopause, but during perimenopause that same number can appear elevated on one draw and suppressed on the next. Add oral contraceptives containing estrogen into the mix, and FSH gets suppressed outright, making the result close to meaningless for staging purposes. There's also a piece of FSH biology that rarely makes it into the conversation: research links elevated FSH to depression-like neurological effects, to direct regulation of bone remodeling through osteoclast receptors, and to shifts in total cholesterol. None of that gets interpreted on a routine panel. FSH gets read as a staging number and nothing else.
Estradiol has the same fundamental problem. One draw catches one moment in a signal that oscillates constantly, so a result sitting comfortably inside the reference range only confirms that estrogen was in range at that specific hour, on that specific day. It can't distinguish early perimenopause from a woman's normal monthly variation, because both can produce the exact same number.
Progesterone often isn't drawn at all unless pregnancy is a concern. Even when it is tested, timing relative to ovulation rarely gets controlled for, and a progesterone level without knowing whether ovulation happened that cycle doesn't tell a clinician much. Its early decline against still-fluctuating estrogen creates what looks like estrogen dominance, which drives real symptoms while appearing as nothing abnormal on a disease-screening panel.
AMH is almost never ordered in standard care, despite being one of the more linear, stable markers across the whole transition. Some recent research suggests AMH may help predict the timing of the final menstrual period within a one to two year window, though it hasn't become standard practice yet. Leaving it off routine panels means one of the few markers that actually holds still long enough to be useful goes uncollected.
SHBG gets skipped just as often, and rarely gets read in context when it is included. A woman can have completely normal total testosterone and still have very little of it free and usable, because elevated SHBG binds it up. That matters for libido, energy, mood, the symptoms women describe most and get believed about least. Oral estrogen therapy raises SHBG further, which can quietly undercut testosterone even while every other marker looks fine on paper. And the normal range for SHBG in women spans a wide 18 to 144 nmol/L, wide enough that a single value without clinical context tells a provider very little.
Thyroid panels are often ordered, but as a way to rule perimenopause out rather than evaluate it alongside thyroid function. Thyroid dysfunction mimics perimenopausal symptoms closely, fatigue, mood changes, weight shifts, so a normal thyroid result frequently gets used to close the conversation instead of opening the next one.
Why the timing and framing of the test matters as much as which markers are ordered
Two blood draws, same woman, two weeks apart, can produce opposite results. That's not measurement error. That's the actual biology of perimenopause, where hormone levels swing from very high to very low within a single cycle. Without controlling for cycle day, or at minimum confirming whether ovulation happened, an estradiol or progesterone number carries limited weight on its own.
A study published in the journal Menopause gave a name to something a lot of women had been describing without a clinical label for it: "Not Feeling Like Myself," or NFLM. The study's contribution wasn't diagnostic, it was validating: normal-range labs and genuine, disruptive symptoms coexist regularly enough to warrant naming the pattern. That matters because reference ranges are built from population averages, not from any individual woman's own baseline. A woman whose estradiol has dropped substantially from where it used to sit for her can still land inside the population range and get told everything looks fine.
Testing without clinical guidance cuts both ways, too. It can produce false reassurance, everything's normal, so the symptoms get chalked up to stress or aging, or it can produce unnecessary alarm, a value that's clinically unremarkable once put in context looks frightening sitting alone on a lab report. Somewhere between 80 and 90% of women experience symptoms during the menopausal transition. That's not an edge case needing special explanation. That's most of the population this testing is supposedly built to serve.
What a single snapshot cannot show: the case for tracking hormone patterns over time
Reproductive aging moves. A single draw captures a moment, not a trajectory, and the difference between those two things is the whole argument for tracking hormones over time rather than checking them once and filing the result away.
Certain patterns become visible only across multiple draws: intermittent estrogen spikes paired with progesterone that never rises the way it should, FSH climbing gradually against a backdrop of falling estradiol, LH signaling that gets progressively more erratic. Any one of these, seen once, looks like noise. Seen across months, it looks like a direction. And that direction is what connects to real physiological change, sleep disruption, bone remodeling, cardiometabolic shifts, vasomotor symptoms, none of which a single panel is positioned to surface.
The most useful reference point for a woman is her own baseline, what her hormones looked like when she was cycling normally. It's her own baseline, what her hormones looked like when she was cycling normally. A drop that's clinically significant for her personally can still sit inside a population-wide "normal" band, which is precisely how normal labs and real symptoms end up coexisting so often. STRAW+10 itself is built on this same longitudinal logic. Staging depends on how the menstrual pattern changes over time, not on where a single measurement lands.
Tracking also does something a snapshot structurally cannot: it lets a clinician tell the difference between a fluctuation and a trend. A hormone value that dips and comes back is not the same clinical situation as one that keeps declining, and treatment decisions should probably look different depending on which is happening. Hot flashes make the stakes concrete. They're the most documented vasomotor symptom of the transition, affecting roughly three in four women, with a median duration of around seven years. Knowing where a woman sits inside that seven-year arc, early, middle, tapering, takes more than a single data point.
The downstream health risks that go undetected when hormonal change isn't tracked
Bone density loss is the clearest example of a cost that accrues silently. Research has documented bone mineral density losses of 9.1% at the femoral neck and 10.6% at the lumbar spine over a ten-year window tied to the menopause transition. The loss accumulates across the perimenopausal window, before menopause itself arrives, which makes that window, not the postmenopausal one, the moment when early intervention actually has leverage. Rising FSH and falling estradiol are part of the broader hormonal shift occurring across this same window. Those hormonal changes appear in the bloodwork while structural damage is still accruing. But only someone tracking the trend would see it coming; standard bloodwork doesn't include bone turnover markers or trigger a DEXA referral based on hormonal trajectory.
Cardiovascular risk follows a similar quiet pattern. Declining estrogen tracks with rising metabolic and cardiovascular risk, yet standard cardiovascular screening isn't typically linked back to hormonal staging at all. Elevated FSH correlates with total cholesterol and with rates of hypercholesterolemia in women, a connection a standard lipid panel has no mechanism to flag, because it was never built to read cholesterol through a hormonal lens.
Then there's the neurological piece, which may be the most under-recognized of all. Research has shown FSH can produce depression-like effects in a dose-dependent way, tied to elevated pro-inflammatory cytokines. That's a real physiological mechanism, not a mood complaint to be managed with reassurance. And the first symptoms of perimenopause are frequently neurological anyway, fatigue, anxiety, brain fog, emotional swings that get attributed to stress or garden-variety depression long before anyone considers a hormonal transition as the actual driver.
The thread running through all three: the perimenopausal window is exactly when intervention would do the most good. It's also the window a disease-detection panel is least equipped to see, because nothing has broken yet. That's the whole point of a screening panel, and also its blind spot here.
What a more complete perimenopause-focused panel looks like
A panel built for perimenopause, rather than repurposed from general screening, would order FSH, LH, estradiol, and progesterone together, timed against the cycle where possible, and read as a set rather than four unrelated numbers. AMH belongs in there too, adding a longitudinal, comparatively stable read on ovarian reserve that balances out the volatility of FSH and estradiol. SHBG matters for interpreting how much testosterone is actually available to tissue, particularly for women reporting libido changes or already on oral estrogen therapy.
A full thyroid panel, TSH, free T3, free T4, should run in parallel rather than as a substitute, given how much symptom overlap exists between thyroid dysfunction and perimenopause. Cholesterol and blood glucose belong in the panel too, interpreted with hormonal status in mind rather than scored against generic cutoffs alone. Vitamin D matters for bone health during a stretch when bone turnover is already accelerating.
None of this replaces a clinician's read. A stack of numbers without interpretation is still just a snapshot, a fuller one, but a snapshot. The markers need to be weighed against a woman's history, her symptom picture, and ideally her own prior values, not measured only against population ranges.
Some women pursue additional testing outside standard bloodwork: saliva testing for free, unbound hormone levels, or dried urine testing (DUTCH) for hormone metabolites and free cortisol patterns, which can offer insight into how hormones are being metabolized rather than just their circulating levels. This can be particularly relevant for women on topical hormone therapy, since transdermal delivery doesn't distribute through the bloodstream the same way oral dosing does. These methods sit outside standard clinical panels, and any woman considering them should bring the conversation to a clinician rather than interpreting results alone.
The practical value of knowing this list is vocabulary. It's vocabulary. A woman who can ask specifically for AMH, SHBG, and a properly timed progesterone draw is having a fundamentally different conversation than one who reports symptoms and waits to be believed.
How longitudinal, clinician-reviewed hormone data changes what a woman can do with her results
A single normal result answers one question: no disease was found. It says nothing about where a woman sits inside a transition that averages around four years and can run as long as ten. Data that moves with her across that span answers a different, more useful question, not just where she is, but which direction she's heading.
That shift changes the conversation in the exam room. A woman who can point to a pattern, FSH climbing, estradiol trending down, progesterone peaks that never quite reach the expected level, isn't asking a provider to take her word for how she feels. She's bringing evidence of a trajectory, which is a fundamentally different starting point than a symptom list that could plausibly be pinned on stress, age, or anxiety instead.
Clinician review still matters here, and skipping it undercuts the whole exercise. Data without expert interpretation can produce the same false reassurance, or the same unnecessary alarm, as a single snapshot, just with more numbers attached to it. The goal was never to hand a woman a spreadsheet and have her diagnose herself. It's to get her into the room with something specific and trackable to point to.
Perimenopause remains widely under-diagnosed and under-explained, and women who've been told their labs are fine while their symptoms persist are not the exception here; they're closer to the norm. Access to their own longitudinal data, reviewed by someone who understands what the trend actually means, is one of the few concrete levers available to change that dynamic. It doesn't guarantee the right treatment or the right timing on a bone scan. But it gives a woman something sturdier to stand on than a single "normal" result and the sense that no one quite believes what she's describing.