Reading the Signal in Noisy Estrogen and Progesterone Data Across a Perimenopausal Year
Longitudinal hormone tracking reveals perimenopause's erratic patterns better than single tests.
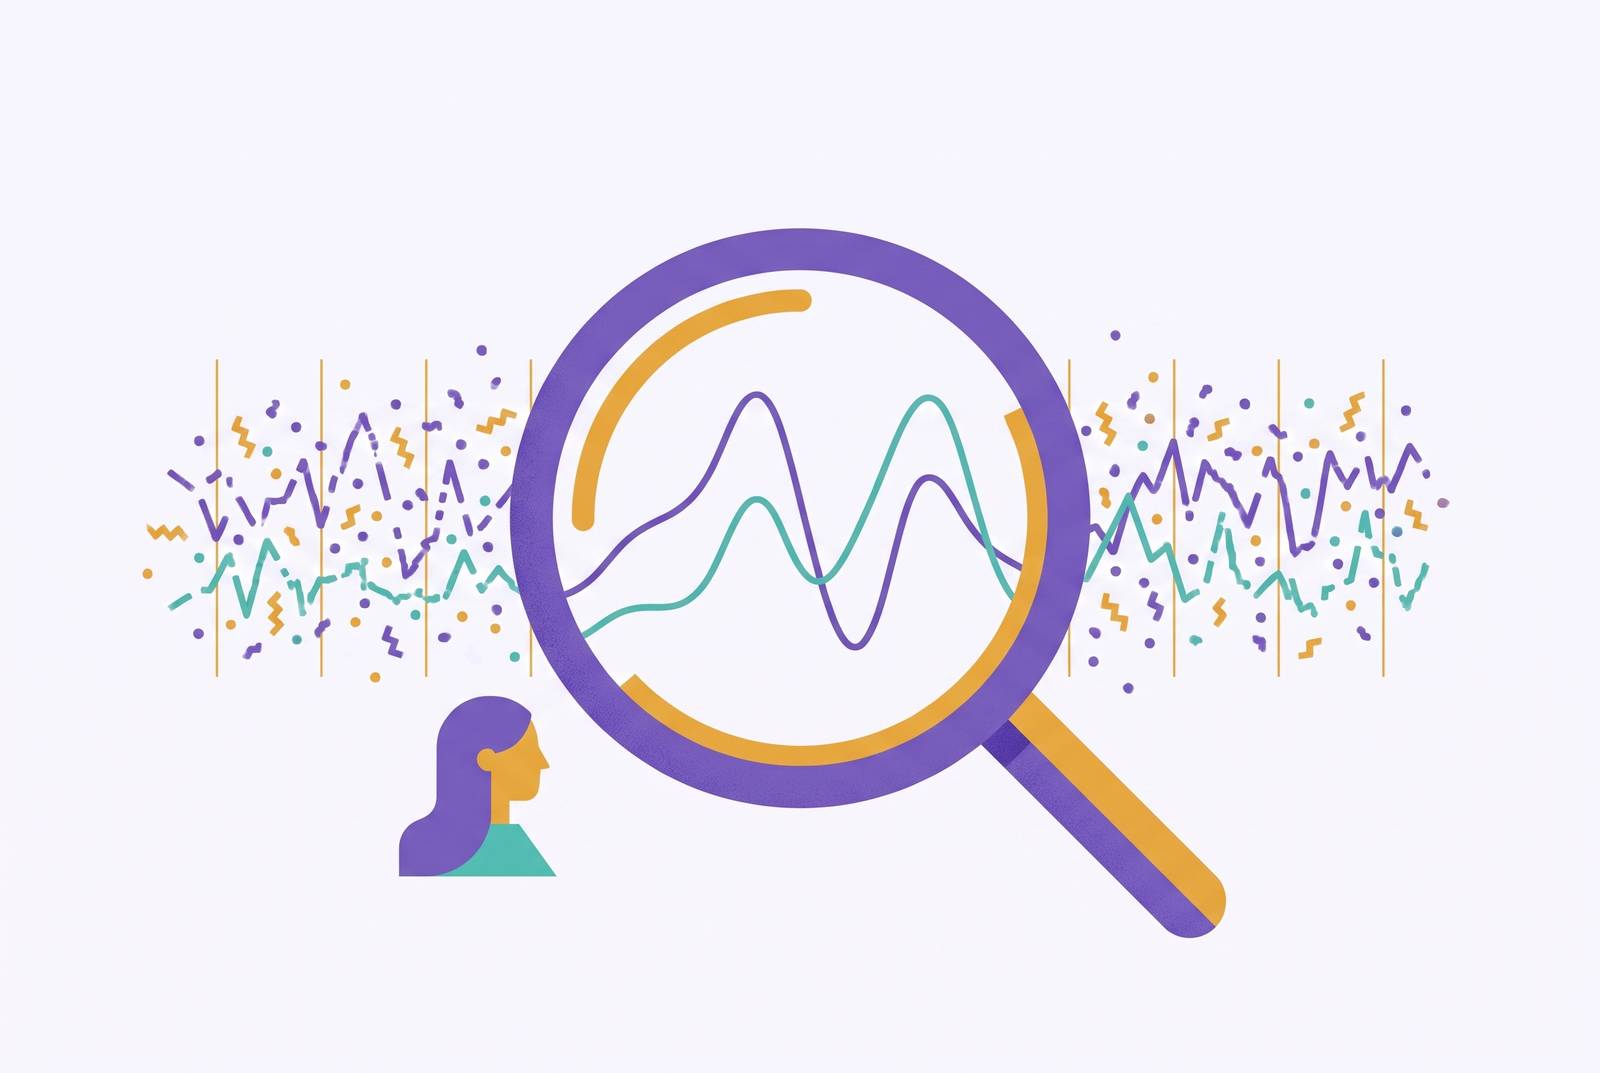
Longitudinal perimenopause hormone tracking pairs repeated, cycle-timed estrogen and progesterone measurements with cycle records and symptom logs. Across a year, this can reveal changes that a single “normal” result misses, because estrogen surges and falls. The value is not a definitive test for perimenopause, but an individual record that a clinician can interpret against symptoms, age, and menstrual changes.
Why a single hormone result tells you almost nothing during perimenopause
A woman can have disrupted sleep, hot flashes, and mood changes while holding a hormone report marked “normal.” The contradiction can feel like a choice between believing her symptoms and believing the laboratory. Yet both can be accurate at once. The result describes her hormone level at the moment of collection, while her symptoms unfold across days and cycles. A measurement can be correct without answering the question it was meant to settle.
During perimenopause, estrogen surges, crashes, and can rise above premenopausal levels before eventually declining. Longitudinal studies show that estradiol can be elevated on a test day even in a woman experiencing symptoms. This is expected biology.
What, then, can a “normal” estradiol result exclude? On its own, it cannot rule out perimenopause. Clinical guidance says perimenopause is a clinical diagnosis based on age and symptoms, so hormone levels alone are not enough. A woman told she is fine after one test may therefore have received an accurate measurement but an insufficient explanation. The missing information is how that result fits into change over time.
The hormonal mechanisms that produce contradictory readings
Estradiol, FSH, and progesterone tell different parts of the transition’s story. Their signals do not move in lockstep. As follicle quality and quantity decline, the ovaries can produce erratic bursts of estrogen. A single estradiol measurement may catch a surge or a low point, neither of which describes the course between them. That volatility explains why two apparently contradictory results can belong to the same transition.
FSH adds a feedback loop to the picture. When estradiol drops, the pituitary releases more FSH to stimulate the ovaries to produce more estrogen. Yet FSH can remain within a clinically “normal” range for years after symptoms begin, limiting its usefulness as a standalone early marker. There is also a less visible complication. Age-dependent changes in FSH glycoform abundance affect its bioactivity in ways standard panels do not capture, so the reported concentration does not tell the whole story.
Progesterone offers a relatively clearer early signal. Unlike estradiol, it follows a more consistent downward trajectory that begins earlier in the transition. Serum progesterone can be measurably lower in perimenopausal women even when their FSH and estrogen resemble those of premenopausal controls. This makes mid-luteal progesterone useful to track early on, as long as it is measured at the right phase of the cycle.
What the STRAW+10 staging framework reveals about how long this transition actually lasts
The STRAW+10 framework sets out stages of hormone change that are defined in part by menstrual changes. It distinguishes late reproductive years, early perimenopause, late perimenopause, and postmenopause. In early perimenopause, cycles can vary by more than seven days, while in late perimenopause, periods can be absent for 60 days or longer. Menopause itself is a retrospective milestone. These distinctions give a year of observations a place within a much longer process.
The duration changes what a year can explain. Perimenopause can begin in the mid-30s, and the transition can last up to a decade or more. A year can give a woman a detailed record while covering only part of the transition. Waiting for one definitive hormone result risks mistaking a long, changing process for a condition that should announce itself in a single draw.
The SWAN data show that, on average, Black women reach menopause earlier than white women. The same study links financial stress and lower educational attainment with earlier natural menopause. These are population findings. These findings help explain why a woman’s age alone cannot tell a clinician how to read her symptoms and cycle changes.
What the Swiss Perimenopause Study showed a year of serial data can and cannot resolve
The Swiss Perimenopause Study followed 127 perimenopausal women aged 40–56 for 13 months, measuring their hormones repeatedly during that time. It found highly individual fluctuations in estradiol and progesterone across that period. There was no single trajectory for everyone. The study supports reading a woman’s sequence of results rather than expecting one level to describe her experience. Repeated measurements make individual variability visible.
A study measuring hormones four times within 14 months found notable estradiol variability between measurements, while daily measurement revealed day-to-day variability. More frequent sampling can reveal changes that wider intervals miss. It does not, however, make every fluctuation clinically meaningful or establish one ideal testing frequency for everyone.
Research protocols also draw attention to the edges of the observation window. Prospective tracking ideally begins two to three months before a first assessment and continues two to three months after the last, providing context beyond the assessment dates themselves. Even then, collection is not interpretation. A sequence that is expected for one woman may look concerning in another, and the meaning depends on symptoms and cycle history. Before comparing results, there is another question to resolve. Were the samples taken at comparable points in the cycle?
How timing within the cycle determines whether a hormone result is informative
Repeated testing is not automatically comparable testing. If each sample comes from a different cycle phase, the record can mix normal changes within a cycle with changes over the course of the transition. Measurements should be anchored to a consistent, meaningful point where possible. That gives the comparison a firmer basis than a series of results collected whenever an appointment happens to be available.
FSH is most consistently interpretable on day three of the menstrual cycle. A mid-cycle or randomly timed result is harder to compare across visits. Estradiol is most consistently interpreted during a period, although even a well-timed measurement remains a snapshot. Comparing its levels at the same cycle-day point over several cycles is more useful than taking each result as an answer on its own.
Progesterone needs to be measured at a different time, during the luteal phase, typically days 19–21 of the cycle. A result in this phase can help establish whether ovulation occurred and reveal progesterone’s early decline. But choosing a date for a test becomes harder as cycles grow irregular. The typical window is therefore not a substitute for identifying the relevant phase.
When cycle-day anchoring is difficult, a clinician may recommend repeat testing at intervals to identify directional trends. Recording when each sample was taken remains part of what makes the result interpretable.
Why perimenopausal symptoms get misread as anxiety, depression, or thyroid disease
Many perimenopausal symptoms are also symptoms of anxiety, depression, and thyroid dysfunction. That overlap creates a genuine diagnostic problem. A 2025 national survey found that close to two in five women reported being misdiagnosed when seeking care for perimenopause symptoms. More than half of those women were treated for anxiety, depression, mood swings, or panic attacks instead. A normal hormone result can leave the hormonal context unexplored and the diagnostic ambiguity unresolved.
A psychiatric diagnosis is not necessarily wrong. Anxiety and depression are more common during perimenopause, and changes in hormones can play a direct part in those symptoms. Falling progesterone reduces GABA activity through its metabolite allopregnanolone, disrupting the brain’s primary inhibitory neurotransmitter system and increasing anxiety. Treating symptoms without considering this hormonal driver can leave part of the explanation unaddressed.
The risk of major depressive disorder appears to rise during dynamic hormonal flux, with rates roughly doubling to tripling compared with premenopausal and late postmenopausal periods. The Royal College of Psychiatrists’ March 2026 position statement warned that perimenopause symptoms too often go unrecognised. It highlighted women not being asked about their hormonal status when presenting with mood or psychological symptoms.
Thyroid disease introduces a further reason not to settle too quickly on one explanation. The European Menopause and Andropause Society’s 2024 position statement notes that sweating, mood swings, anxiety/depression, decreased libido, and menstrual irregularities “can also characterize thyroid disease.” It advises maintaining a low threshold of suspicion for thyroid disease when these symptoms appear. Declining estrogen also increases the likelihood of developing hypothyroidism, so the conditions need not be alternatives.
A longitudinal record can show whether symptoms cluster around menstrual and hormonal changes, giving a clinician evidence that a single result lacks.
What a year of tracked data looks like in practice and what it makes visible
A useful record might show estradiol falling over the year when the measurements are taken at times that allow them to be compared. Another might show large rises and falls while the average stays much the same. Those are different pictures of hormonal change. Either could include an isolated result within the same reference range.
Progesterone and FSH add other readable features. Consistently low luteal progesterone across multiple cycles can signal declining ovulatory frequency, while successive day-three FSH results may show a rising trend even when every result remains within the laboratory’s “normal” range. Comparable measurements can show whether hormone levels exhibit a repeated or directional change.
Symptoms give those trajectories a human timescale. Sleep disruption, mood shifts, hot flashes, or cognitive symptoms may repeatedly intensify around particular hormonal phases. These links can help explain when symptoms are at their worst and make those times seem less random. They do not, by themselves, establish that every symptom has a hormonal cause.
A woman’s previous results thus provide a personal baseline that population ranges cannot supply on their own. That baseline provides context. A year extends the view beyond one cycle or season, but clinician review is what distinguishes an expected fluctuation from a concerning trend within the whole clinical picture.
How women can track hormones over time at home and make clinical conversations more productive
For women building their own longitudinal record, cycle tracking is the most accessible starting point. It requires no hormone test to begin. Recording cycle lengths makes it possible to identify variation of more than seven days or gaps of 60 days or longer, linking home observations to the staging framework. This establishes a menstrual timeline before laboratory measurements are added.
It helps to record when sleep disruption, mood shifts, hot flashes, and cognitive symptoms occur in the cycle. Consistency is more informative than an isolated description of a particularly difficult day. Symptoms recorded without cycle context are harder to attribute, while a shared timeline allows a clinician to examine whether their timing recurs.
Where serial blood testing is used, the measurements add a hormonal layer to the home record. Draws timed consistently across multiple cycles make comparison more useful, and even two or three draws spaced across a year can provide more information than one snapshot. Women can start keeping cycle and symptom records at home, while a clinician can help plan when to test and explain what the results mean.
A survey of women aged 45–60 found that more than half had never discussed perimenopause with a healthcare provider, and only a small fraction felt adequately informed when symptoms began. Roughly one in three women report not feeling confident advocating for themselves in healthcare settings. Instead of asking one “normal” result to explain a year of symptoms, a woman can bring the dates, changes, and recurring associations that need an explanation.