Continuous Glucose Monitors vs Fasting Glucose for Metabolic Assessment
CGM reveals glucose swings a single blood test can never catch, especially during hormonal shifts.
Fasting glucose tells you one thing: what your blood sugar looked like at a single moment, usually right after waking, before food. Continuous glucose monitoring tells you something categorically different, the shape of glucose behavior across hours, meals, sleep, and stress. That distinction matters for anyone trying to understand their metabolic health, but it matters especially for women in perimenopause, when hormonal swings destabilize glucose regulation in ways a once-a-day snapshot can't register. This piece walks through what each tool actually measures, what the data shows once hormones start shifting, and where the two approaches genuinely complement rather than compete with each other.
Fasting glucose and HbA1c became the default screening tools for practical reasons more than theoretical ones. Fasting glucose is a single blood draw taken after roughly eight hours without food, and it produces one number. HbA1c measures the percentage of hemoglobin proteins that have glucose attached to them, which reflects average blood sugar over the preceding two to three months, since red blood cells live about that long. Both tests are cheap, fast to run, and available at nearly any lab or clinic, which is exactly why they became the clinical default. They answer a narrow but useful question: is glucose elevated right now, or has it been elevated on average over a couple of months?
What neither test can do is see what happens in between. Glucose spikes after a meal, dips overnight, and climbs under stress, and none of that appears on a fasting draw or an HbA1c result. Two people can have identical fasting numbers, with one holding a flat 95 mg/dL all day and the other swinging from 70 mg/dL to a much higher peak after every meal and landing at 95 mg/dL again by morning. The averaging built into HbA1c has the same blind spot: someone with frequent highs and lows can register the exact same HbA1c as someone whose glucose barely moves. The math smooths out the very pattern that might matter most.
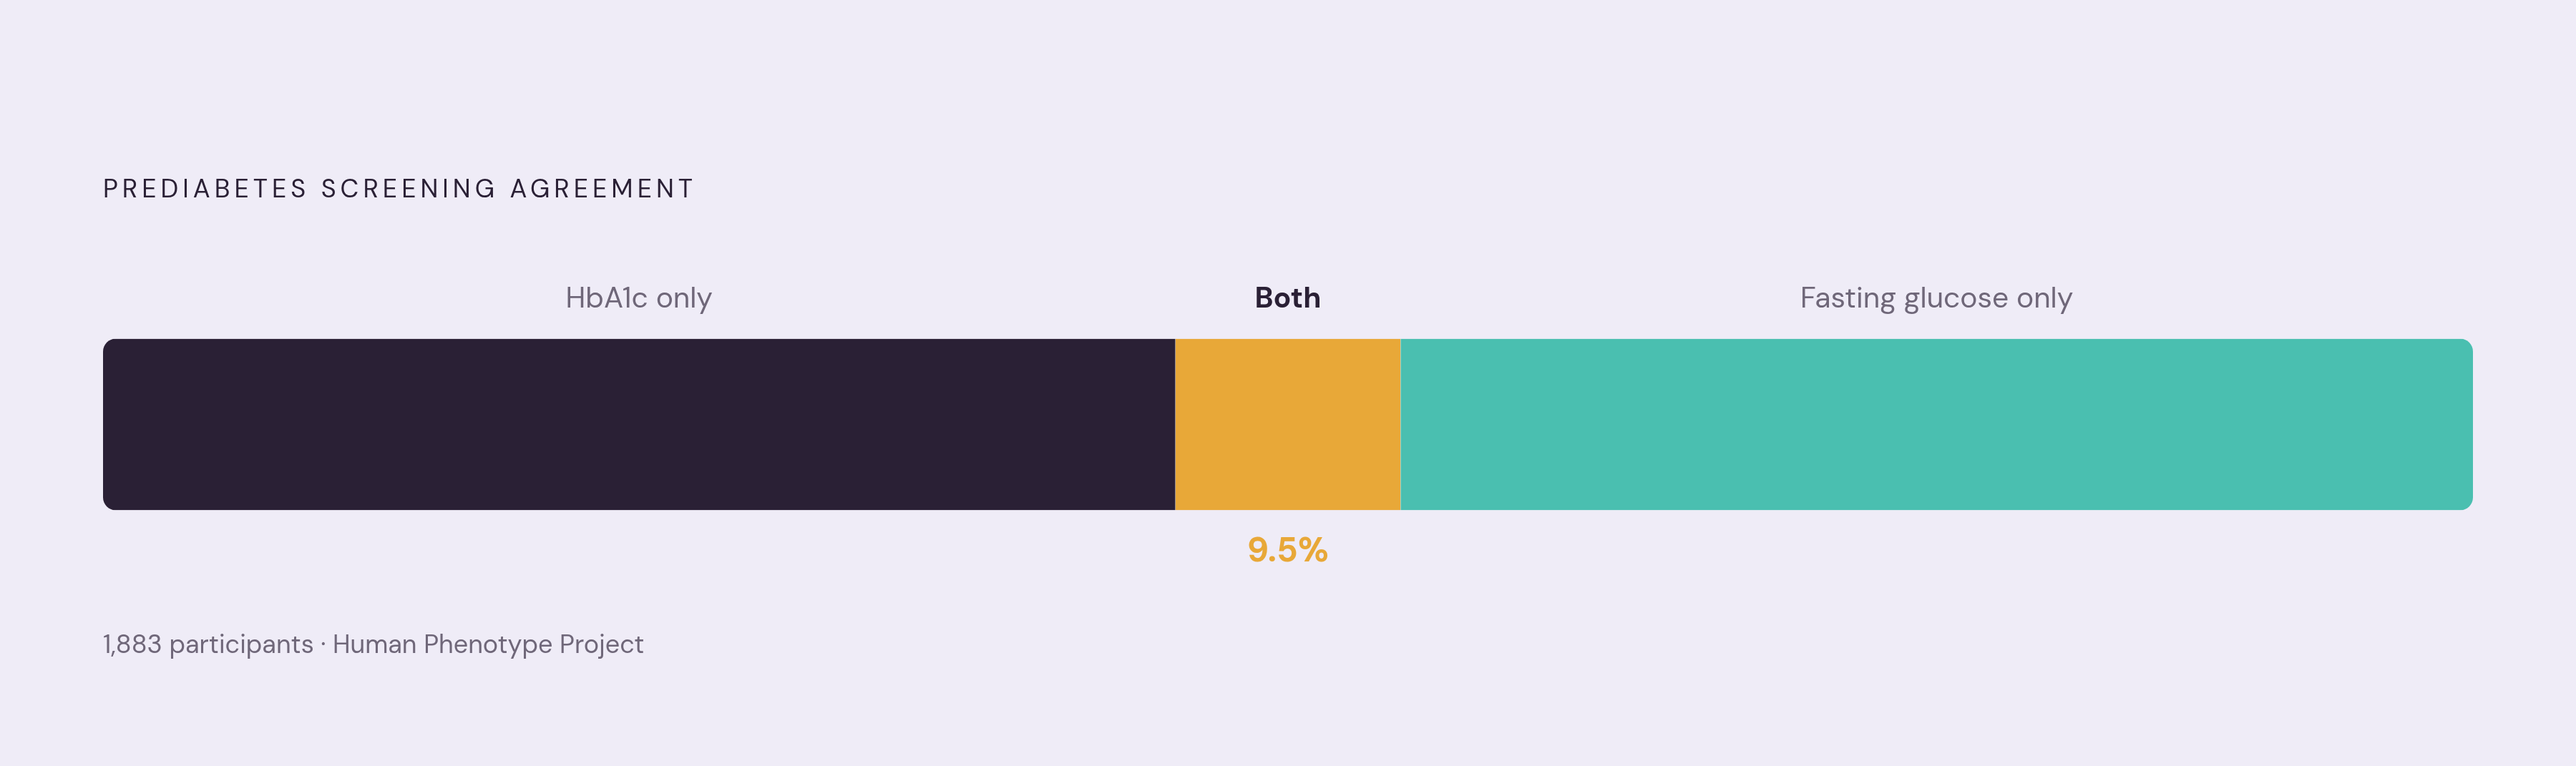
The two tests don't even reliably agree with each other. A cross-sectional analysis from the Human Phenotype Project, covering 1,883 participants, found that only 9.5% met prediabetes criteria on both HbA1c and fasting plasma glucose at the same time. Read that again: fewer than one in ten people who qualified as prediabetic by either measure qualified by both. That's not a rounding error, it's a structural problem with relying on any single static snapshot. If two of the most common tests in metabolic medicine routinely disagree, leaning on just one of them, whichever your clinic happens to order, risks missing people who are at real metabolic risk but happen to look fine on that particular test on that particular day.
What CGM measures and why dynamic data is different in kind, not just degree
A continuous glucose monitor doesn't draw blood. A small sensor sits under the skin, usually on the back of the arm or abdomen, and measures glucose in the interstitial fluid, the fluid between cells, continuously, updating continuously around the clock. Worn over one to two weeks, it builds what's called an ambulatory glucose profile (AGP), a composite picture of glucose behavior across day and night, meals, exercise, and sleep. What started as a tool mainly for people managing type 1 diabetes has moved into broader use, to the point where CGM is now considered a standard part of care in diabetes management rather than an optional add-on.
Three metrics do most of the work in reading a CGM report. Time in range (TIR) is the percentage of the day glucose spends within a target band, typically 70 to 180 mg/dL. Time above range (TAR) tracks how long glucose sits above 140 mg/dL, capturing the postprandial and stress-driven spikes that a fasting test, taken hours after the last meal, will never catch. Glucose variability measures how widely levels swing over time, and it turns out that variability itself carries risk independent of the average. Two people can share the same mean glucose and post very different variability scores, and the evidence increasingly suggests that difference is not just noise.
A study looking at adults with no diabetes and no cardiovascular disease found that higher mean CGM glucose and more time spent above 140 mg/dL were associated with hypertension and elevated cholesterol. Those associations were not apparent from the static metabolic markers measured in the same participants. That's a striking result on its own terms: the dynamic pattern flagged a risk relationship the static snapshot missed entirely, in people whose fasting numbers gave no reason for concern.
CGM also appears to catch trouble earlier. CGM metrics can reveal glucose differences between prediabetic and normal-regulation groups that static markers may not capture at the same threshold. Research synthesizing CGM data has identified consistent, measurable differences in mean glucose, variability, and time above range between people with prediabetes and those with normal glucose regulation. So the pattern isn't anecdotal or isolated to one study, it holds up across a body of evidence large enough to synthesize.
What's the underlying structure here? Research breaking down CGM data into its component features found that mean glucose, variance, and autocorrelation (essentially, how strongly one glucose reading predicts the next) together account for more than 80% of interindividual differences in CGM-derived measures. Together, those three features capture a richer picture of a person's glucose dynamics than fasting glucose or mean glucose alone can provide. And each of those three features has been linked to cardiovascular and metabolic risk markers through pathways a fasting test structurally cannot reach. Glucose dynamics are tied to cardiovascular and metabolic risk through pathways a fasting test structurally cannot reach, no matter how many times you repeat it.
How perimenopause destabilizes glucose regulation and makes dynamic monitoring especially relevant
Perimenopause is the transitional window, usually starting in a woman's mid-40s though sometimes as early as the late 30s, during which ovarian output of estrogen and progesterone declines. Not in a straight line, though. It's an erratic, fluctuating decline, which is precisely why perimenopause is defined clinically by menstrual irregularity rather than by a fixed hormone level. Menopause itself only gets confirmed retroactively, after twelve consecutive months without a period, and the average age for that marker in one country is 51. The instability, more than the decline itself, drives a lot of what women experience during this stretch, both symptomatically and metabolically.
Estrogen does real work in glucose metabolism, regulating insulin production and influencing where the body stores fat. Research has found that as estrogen becomes unstable during perimenopause, women may see increased insulin resistance and a higher risk of metabolic disorders. Part of the mechanism involves visceral fat, the deep abdominal fat associated with elevated metabolic risk. When estrogen output becomes erratic and declines, visceral fat accumulates more easily, compounding insulin resistance rather than sitting alongside it. Estrogen also helps maintain muscle mass and supports glucose uptake during exercise, so muscle loss during this transition removes one of the body's main routes for clearing glucose from the blood. Evidence points to menopause as a risk factor for insulin resistance independent of age, and the estrogen-insulin link appears to hold even once body weight is accounted for. This isn't just a weight-gain story, it's a hormonal one.
Progesterone follows its own separate track during perimenopause, and as it rises and falls erratically, glucose regulation is further disrupted. This is precisely the kind of variability a single fasting draw is built to miss, since it captures neither a rise nor a fall, only whatever value happens to land at the moment of the test.
Meanwhile, the pituitary gland is sending its own signal. As ovarian function winds down, the pituitary ramps up follicle-stimulating hormone (FSH) to try to prompt the ovaries into action, so rising FSH tracks declining ovarian reserve. Rising FSH tracks the declining ovarian reserve that underlies many of the symptoms women experience during this transition. FSH is one of several markers, alongside AMH, inhibin B, and antral follicle count, used to support staging under the STRAW+10 framework, though menstrual cycle characteristics remain the primary criterion clinicians use to stage where a woman sits in the transition.
What CGM data shows when women reach perimenopause and beyond
The most direct evidence on CGM use across the menopausal transition comes from the ZOE PREDICT study, which followed 1,002 women, split into 366 pre-perimenopause, 55 perimenopause, and 206 postmenopausal participants. Researchers combined continuous glucose monitoring with concurrent blood testing. Postmenopausal women showed higher fasting glucose and higher HbA1c than pre-menopausal women, which lines up with what standard blood work would already suggest. But postmenopausal women also showed higher postprandial glucose responses and higher insulin levels after meals, findings that point to the importance of tracking metabolic risk factors in women across the menopausal transition.
Here's where the CGM data earns its keep beyond what the blood tests alone showed: post-meal glucose responses and glucose variability were measurably worse in postmenopausal women compared to pre-menopausal women. A fasting draw taken at the same clinic visit would have flattened all of that into a single number, telling a clinician nothing about the shape of the day. Broader CGM data across other populations echoes the same pattern: postmenopausal women showed higher fasting blood glucose and HbA1c compared to pre-menopausal women, and dynamic CGM metrics added further resolution to those differences.
But what about perimenopause itself, the stage before menopause is confirmed? That's where the picture gets thin. The ZOE PREDICT study's 55 perimenopausal participants represent a small slice of the total sample, and perimenopause remains the most understudied group in menopausal metabolic research generally. That's a real gap, not a minor caveat. Hormonal variability peaks during perimenopause, not after it, which is exactly when CGM's capacity to track day-to-day and within-day fluctuation would seem most valuable, even though the direct evidence base for this specific group is still catching up. A fasting glucose drawn on a low-estrogen day could look meaningfully different from one drawn on a high-estrogen day in the same woman, weeks apart. Neither reading is wrong, exactly. But neither one tells her what her glucose is doing on an average day, or on her worst day.
Where fasting glucose still earns its place, and what CGM adds that it cannot
None of this makes fasting glucose obsolete. It remains the tool that establishes a baseline, tracked over years, that shows whether chronic elevation is creeping in. It's also the test built into standard diagnostic thresholds: standard clinical definitions for prediabetes and diabetes rely on fasting glucose and HbA1c, and CGM metrics are not currently positioned as direct substitutes for those established markers. It's inexpensive, available at basically any lab, and easy to compare across visits and providers over time. A chronically elevated fasting number is a real signal, even though it's an incomplete one.
What CGM adds sits in the territory fasting glucose structurally can't reach. It shows the postprandial spike profile, meaning which specific meals or foods push glucose above 140 mg/dL and for how long it stays there. It shows overnight behavior, whether glucose drops too low during sleep or creeps upward, none of which a 7 a.m. draw can reveal about what happened at 3 a.m. It captures variability, the swing metric tied independently to cardiovascular and liver disease markers. And it gives feedback fast: CGM data shows the effect of a dietary or lifestyle change within days, while HbA1c reflects only a longer-run average that smooths out recent changes.
Combining CGM metrics with HbA1c gets closer to the predictive power of an oral glucose tolerance test (OGTT), which remains the closest existing tool to CGM's dynamic picture. But OGTT comes with real friction: an overnight fast, repeated blood draws over several hours, and a facility equipped to run the protocol. Completion rates suffer even when clinicians recommend it, simply because the logistics are demanding. CGM worn at home sidesteps that barrier and captures real-world metabolic behavior without asking someone to spend half a day in a clinic chair.
The evidence currently stands at a certain point, though. CGM metrics used for prediabetes classification perform in a range approaching, but not yet replacing, conventional markers, with area-under-curve values between 0.65 and 0.68 across different reference definitions. Dynamic glucose measures are good at identifying heterogeneity: they can show that two people with the same fasting number are metabolically different from each other. But longitudinal validation, tracking these metrics against actual disease outcomes over years, is still catching up before CGM can replace standard testing in a diagnostic setting. The honest framing: CGM complements the snapshot tests, filling in what they leave out, rather than rendering them irrelevant.
How a perimenopausal woman can use this information about her own metabolic picture
Fasting glucose and HbA1c are a reasonable place to start, but they shouldn't be treated as the final word. One estimate, from Griffin Concierge Medical, put the figure at 88% of adults showing at least one marker of metabolic dysfunction despite a "normal" fasting glucose reading. Normal on the static test does not mean normal on the dynamic picture. If fasting glucose and HbA1c disagree with each other, which the Human Phenotype Project data cited earlier shows happens in the large majority of cases, that disagreement itself should be dug into rather than dismissed.
For a woman in perimenopause specifically, CGM can reveal things standard labs are structurally unable to see. It can show whether postprandial spikes are happening regularly even when fasting glucose looks perfectly fine. It can reveal elevated glucose variability, a pattern hormonal instability drives directly and that a lab panel will not catch, since labs only ever capture a single point in time. For women still cycling, it can also show how glucose behavior shifts across the menstrual cycle itself, and how it responds to poor sleep or stress, both of which tend to get disrupted right alongside the hormones during this transition.
One CGM cycle, or one fasting draw, only captures a moment in a process that keeps moving. Because perimenopausal hormones fluctuate rather than decline in a straight line, tracking over months and years reveals trends that a single reading misses. A result that looks fine early in perimenopause may look different two years later, once estrogen has settled at a lower baseline. That kind of longitudinal view matters most for women trying to understand their metabolic trajectory before it crosses into a diagnostic category, not after.
That raises a separate but related issue: perimenopausal symptoms get dismissed routinely, or attributed to something else entirely, stress, aging, diet, when the actual driver is hormonal. Metabolic symptoms in particular, unexplained weight gain, energy crashes, trouble keeping blood sugar steady, are especially prone to being waved off as unrelated to what's happening hormonally. Data, whether from a CGM report or a pattern of lab results over time, gives a woman something concrete to bring into a clinical conversation, a record that shows what's actually happening rather than a description that can be second-guessed or reattributed. That alone doesn't solve the deeper research gap around perimenopausal metabolism specifically. But it does put more information in the hands of the person living through it, which is a reasonable place to end up.