CGM Data Interpretation for Non-Diabetic Women
CGM reveals insulin resistance that standard blood tests miss during perimenopause.
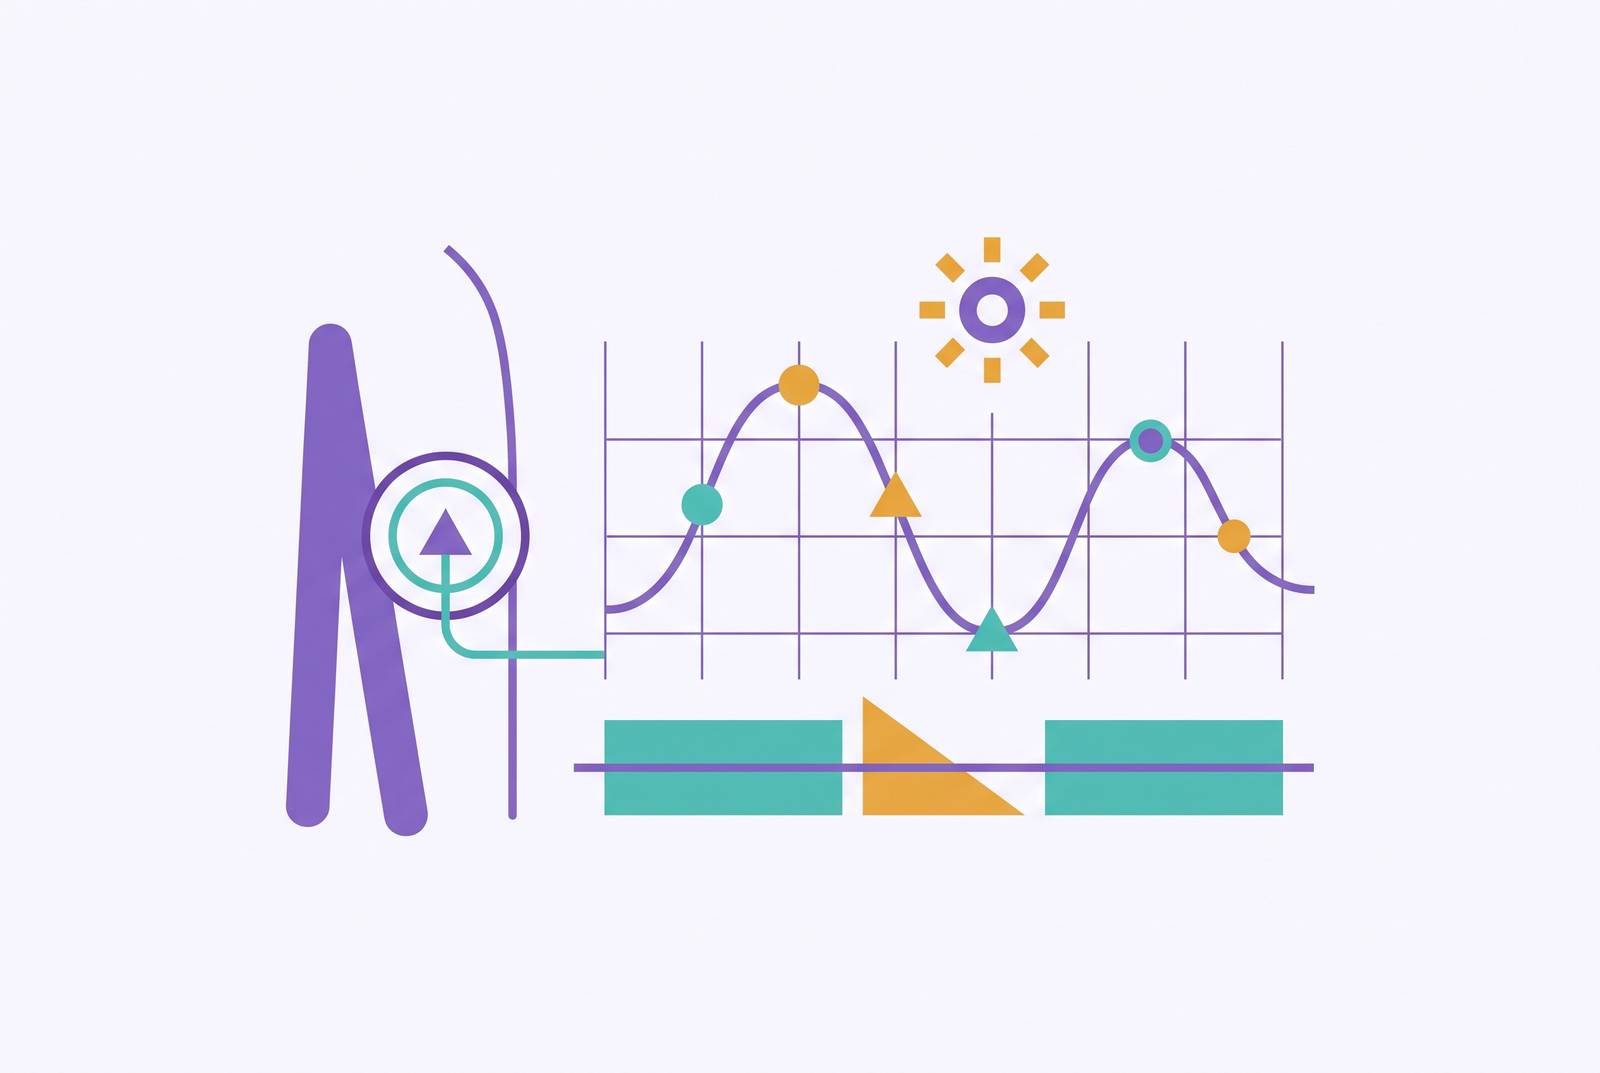
For a non-diabetic woman in perimenopause, a continuous glucose monitor is not reading blood sugar in the way it reads blood sugar in a diabetic patient. It is reading the downstream signature of a hormonal system in transition. Estrogen acts as an insulin sensitizer, and as its signaling turns erratic, the glucose trace changes shape for reasons that have little to do with glycemic disease. The skill lies in knowing which language to read the data in.
Why estrogen loss changes what CGM numbers mean
Estrogen is normally insulin-sensitizing. It helps muscle tissue pull glucose out of circulation, which keeps postprandial responses modest and recovery swift. When estrogen signaling becomes erratic in perimenopause, that sensitizing effect becomes unreliable. Insulin resistance and abdominal fat accumulation then rise together in a self-reinforcing loop, each amplifying the other.
Animal research confirms the causal direction. Removing ovarian estrogen in rodents rapidly induces insulin resistance, independent of diet or weight change. That finding rules out the explanation that midlife metabolic changes are solely about aging or lifestyle. The hormonal shift itself is doing measurable work.
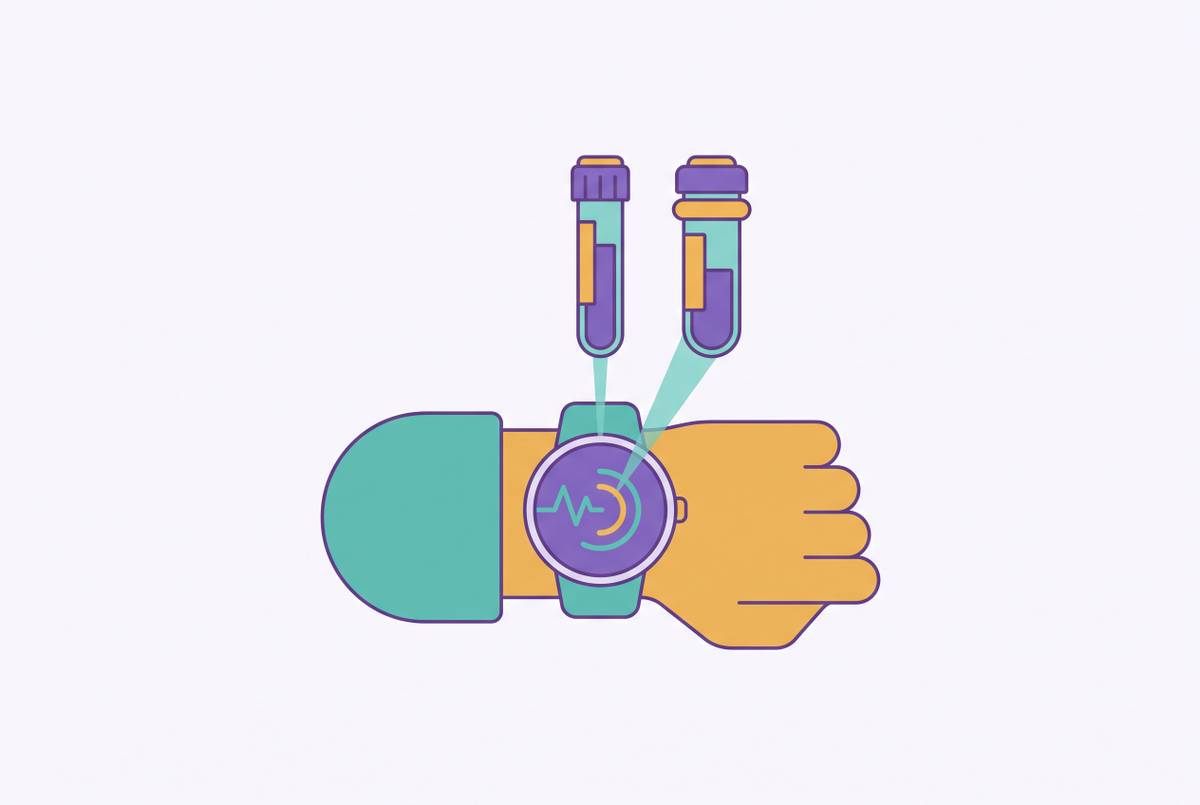
A 2026 study in Clinical Science identified a second mechanism. Dysregulated serotonergic signaling may impair insulin sensitivity independent of estrogen decline, and mice in the study showed impaired insulin sensitivity despite normal fasting glucose and fasting insulin. Standard labs would show nothing wrong. A CGM trace, by contrast, can surface resistance that a blood draw taken on the same day would miss entirely. This is the core translation problem: the data exists, but its meaning depends on understanding the hormonal context that produces it.
How a normal menstrual cycle leaves a CGM signature, and what happens when cycles become irregular
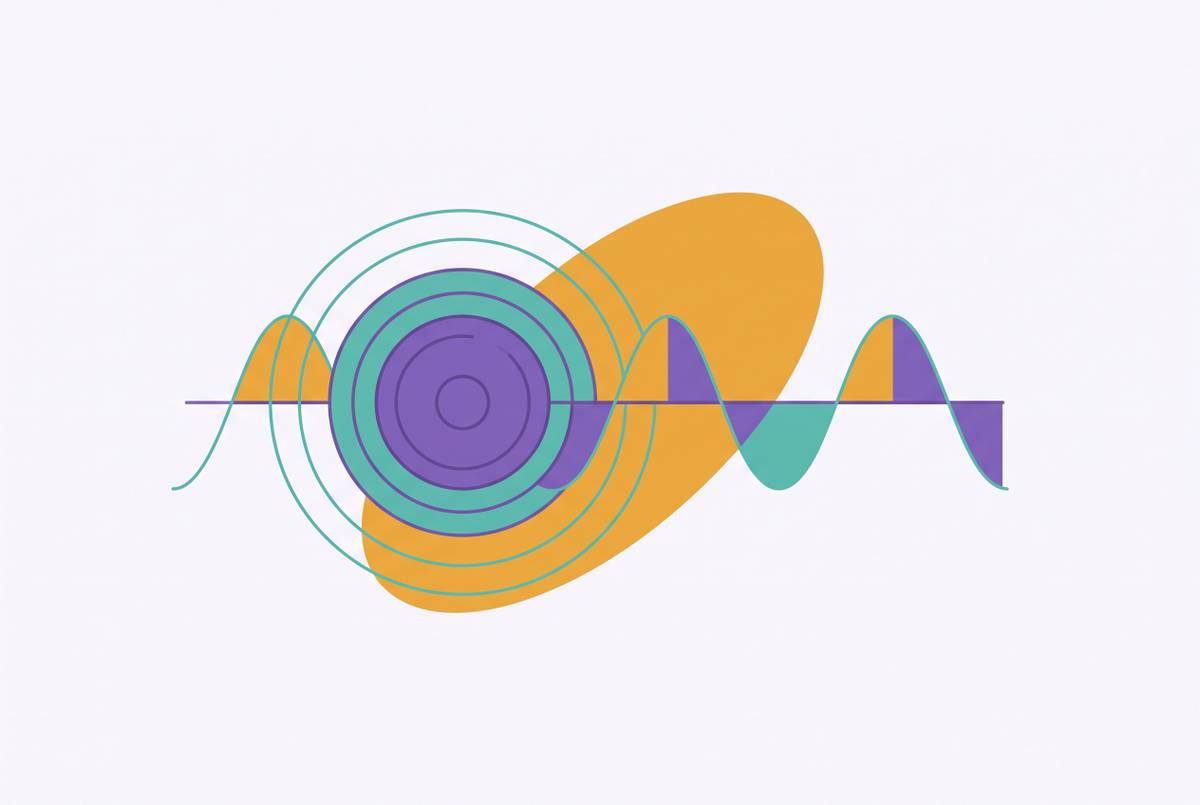
A regular menstrual cycle produces a predictable arc in glucose levels. The Front Endocrinol editorial reports that in most of the study population, glucose levels rose linearly throughout the menstrual cycle, reaching a maximum in the late luteal phase, with a sharp decrease at the beginning of menstrual bleeding. A CGM trace that looks like rising glycemic variability in the week before a period may be physiologically normal. It is not a metabolic warning sign. A woman who interprets that peak without cycle context may overcorrect her diet or exercise in response to a normal hormonal signal.
As cycles become irregular in perimenopause, this pattern fragments. The luteal phase lengthens, shortens, or disappears unpredictably, and the glucose arc that rode on it fragments with it. The CGM trace starts to look erratic not because glucose regulation has failed but because the hormonal scaffold organizing it has become unstable. The smooth wave becomes jagged. That morphological shift, from regular oscillation to irregular noise, is itself diagnostic information, provided the reader knows what a normal cycle signature looks like in the first place.
Which CGM metrics matter for non-diabetic women, and which ones mislead
Time in Range, Time Above Range, and Time Below Range came from diabetes care, where their thresholds were calibrated against glycemic ranges that a healthy woman rarely enters. They have value as gross screens, but they can understate meaningful variability in normoglycemic women. The tighter, more dynamic glucose environment of a non-diabetic perimenopausal woman does not fit their assumptions.
Rate of Change is emerging as the more sensitive metric. A 2025 pilot study in 30 healthy women using the FreeStyle Libre 2 found that a dietary intervention was associated with lower time spent in rising and falling RoC bins, suggesting RoC responds to short-term dietary changes that Time in Range would not register. RoC captures how fast glucose is moving, not just where it is. A glucose level of 5.5 mmol/L climbing steeply tells a different physiological story than the same number falling gently. Glycemic variability itself, the degree of fluctuation across the day, is the metric most directly linked to cardiometabolic risk in observational studies of menopausal women.
The device itself needs skepticism. The FreeStyle Libre 2 showed a consistent upward bias in healthy women, with mean CGM readings running higher than venous plasma glucose, and accuracy in healthy populations has not been widely validated. If you read your CGM against diabetic reference ranges, a biased-high reading may look like a warning when it reflects device behavior in a tighter glycemic range. This is not a reason to dismiss the device. It is a reason to focus on patterns and trends over time rather than treating any single reading as a clinical fact.
What higher glycemic variability in perimenopause actually signals for long-term health
The Cureus systematic review from 2025 found that CGM identified subclinical dysregulation in conditions like menopause and obstructive sleep apnea, linking higher glycemic variability to surrogate cardiovascular risk markers such as blood pressure variability. The review's authors argue that CGM's utility lies in identifying at-risk metabolic phenotypes before hard endpoints emerge. A study presented at the 2026 Annual Meeting of The Menopause Society in San Diego found that premature menopause is associated with increased cardiovascular disease risk linked to estrogen deficiency, and that insulin resistance may partially explain the connection. If insulin resistance is a mechanism in the CVD-menopause link, then CGM-captured early dysglycemia becomes a potentially actionable signal. It is not just a metabolic curiosity but an early warning that standard lipid panels and blood pressure readings may not yet show.
Sleep creates a compounding loop that CGM can make visible. Hot flashes disrupt sleep, disrupted sleep worsens glucose control, and worsened glucose control feeds the cardiometabolic risks already elevated by estrogen loss. If your CGM shows consistently elevated overnight variability, you may be looking at the metabolic footprint of sleep disruption, which is modifiable, rather than inevitable hormonal decline.
The honest framing matters here. The Cureus review is candid that direct evidence of CGM-guided interventions improving hard cardiovascular endpoints remains limited. CGM identifies a real signal that matters. Whether acting on it through lifestyle change demonstrably prevents cardiac events in non-diabetic women is still an open research question.
Why standard glucose labs miss what CGM finds in this population
Fasting glucose and HbA1c were designed to detect diabetes and prediabetes. They are structurally unable to capture the dynamic, fluctuating dysglycemia that perimenopause produces. Front Endocrinol stated directly in 2025 that CGM can reveal abnormal blood glucose fluctuations long before standard fasting blood glucose or HbA1c tests show abnormalities.
The reason is straightforward. HbA1c is a three-month average. It smooths over peaks and troughs. A woman with dramatic postprandial spikes and compensatory dips can show a normal HbA1c while experiencing substantial glycemic instability day to day. The 2026 Clinical Science study finding, mice with impaired insulin sensitivity despite normal fasting glucose and fasting insulin, is the animal-model illustration of the same blind spot. Standard labs show nothing wrong while the dynamic system is already misfiring. CGM captures the dynamic. A blood draw captures a snapshot.
Personalized response is another thing standard labs miss. The Front Endocrinol editorial notes that one person's healthy meal can cause another person's blood sugar to spike dramatically, and CGM is what surfaces that individual variation. In perimenopause, where insulin sensitivity is shifting unpredictably, this personalized feedback matters more, not less.
How hormone testing and CGM data complement each other for perimenopausal interpretation
CGM data in perimenopause is most legible when read alongside hormone levels. The glucose pattern is a downstream effect of hormonal signaling that the CGM cannot itself measure. The STRAW staging framework organizes perimenopause primarily by menstrual cycle characteristics and secondarily by FSH. Knowing where a woman sits in this framework tells her which hormonal influences are currently dominant on her CGM trace. In early perimenopause, estrogen is fluctuating but still present while progesterone is declining, so the late-luteal glucose peak is still recognizable but may be exaggerated. In late perimenopause, FSH is rising and estrogen is lower and more variable, so the cycle pattern on CGM is fragmenting.
A single FSH measurement is unreliable for staging because FSH rises and falls erratically in perimenopause. Two measurements drawn four to six weeks apart, with values above 25 mIU/mL, better indicate the menopausal transition. A woman interpreting a CGM trace without knowing her FSH staging may be misattributing variability to the wrong phase of transition.
A peer-reviewed review published in the Journal of Clinical Medicine in September 2026, led by Dr. Deanna Minich, challenges the standard framing of FSH as a passive marker. FSH receptors have been identified in bone, fat tissue, the brain, blood vessels, immune cells, and the kidneys, raising the question of whether rising FSH is itself a biologically active signal. If FSH acts on fat tissue directly, then FSH levels may help explain why two women with similar estradiol readings show different CGM patterns.
Anti-Müllerian Hormone is an emerging signal for ovarian reserve and may identify women whose glucose dysregulation will emerge earlier in the transition. AMH levels decline with age and become undetectable at menopause. Very low AMH in a woman still experiencing cycles suggests the transition is further along than her cycle regularity implies, and her CGM variability may reflect that. TSH should also be part of any interpretive workup because thyroid disease and perimenopause share symptoms, including menstrual irregularity, mood changes, and metabolic shifts, and thyroid dysfunction independently affects glucose metabolism. A CGM trace that looks like worsening insulin sensitivity may reflect hypothyroidism, not advancing perimenopause. The practical hierarchy is this: estradiol for baseline, serial FSH with two draws four to six weeks apart for staging, TSH to exclude thyroid interference, and AMH when early-onset risk is suspected.
How to read specific CGM patterns in the perimenopausal context
Several CGM patterns that look alarming to a non-diabetic woman are physiologically explainable in perimenopause. Others that look unremarkable can represent meaningful early dysregulation. Pattern 1: Late-luteal glucose rise that resolves sharply at menstruation. This is physiologically normal, caused by progesterone's effect on insulin sensitivity in the luteal phase. In perimenopause it may be exaggerated because progesterone is dropping earlier in cycles. The interpretive action is to track it across cycles rather than responding to a single instance, and to compare it with where the cycle is.
Pattern 2: Rising baseline across repeated similar meals. Tozzi et al. found that pre-meal baselines in normoglycemic individuals shift systematically based on prior postprandial responses. What looks like a worsening trend may be a structured, history-dependent adjustment rather than progressive dysregulation. A single week of higher fasting numbers after a run of large meals does not signal metabolic deterioration. The baseline needs time and consistency to be evaluated meaningfully.
Pattern 3: Erratic overnight variability with no obvious dietary cause. This most likely reflects sleep disruption from vasomotor symptoms such as hot flashes and night sweats. Glucose regulation is impaired by poor sleep independently of daytime eating. The interpretive action is to correlate the CGM overnight trace with sleep quality, not just food, and to address sleep disruption as a metabolic intervention, not just a comfort issue.
Pattern 4: Postprandial spikes that are disproportionate to the meal's apparent glycemic load. This reflects the highly individual nature of glucose response that the Front Endocrinol editorial describes. One person's healthy meal spikes another's glucose dramatically. In perimenopause, insulin sensitivity is shifting, so past experience of safe foods may no longer apply. Treat each food's CGM response as current data, not fixed fact, and re-evaluate foods that previously produced flat responses if the pattern has changed.
Pattern 5: Persistently elevated glycemic variability across phases, not tied to diet or sleep. This may represent subclinical dysregulation that warrants clinical attention. It is the pattern that the Cureus systematic review links to cardiovascular risk markers in menopausal women. The interpretive action is to bring the ambulatory glucose profile to a clinical appointment and request evaluation including serial FSH and fasting insulin, not just HbA1c.
What CGM data cannot do, and when hormone tracking fills the gap
CGM captures the downstream metabolic effect of hormonal change. It cannot identify its cause, its stage, or its trajectory. A spike triggered by cortisol, by progesterone withdrawal, by sleep loss, or by worsening insulin resistance looks the same on the trace. Without knowing hormone levels and cycle phase, the woman and her clinician are guessing at the mechanism.
A single hormone test has the same limitation as a single CGM reading. Hormone levels fluctuate so much in perimenopause that isolated measurements are unreliable, which is why serial testing is the clinical standard. Just as CGM value comes from patterns over time, hormone value comes from repeated measurement that shows the direction of change, not a snapshot.
Bringing both data streams together changes the interpretive picture. A CGM pattern showing increasing variability over three months and a hormone panel showing rising FSH and declining estradiol over the same period gives a clinician the causal context to act, not just the metabolic symptom to observe. The Cureus review notes that CGM-guided lifestyle interventions in non-diabetic populations are promising but that evidence of direct cardiovascular benefit is still limited. Data without expert interpretation is not a clinical plan. A woman who brings her CGM ambulatory glucose profile and her serial hormone results to a clinician is in a far stronger position to get a meaningful response than one who brings either data stream alone.
Sources
- Editorial: Continuous glucose monitoring: beyond diabetes management
- Use of Continuous Glucose Monitoring in Non-diabetic Individuals for Cardiovascular Prevention: A Systematic Review of Its Impact on Guiding Lifestyle Interventions - PMC
- Baseline glycemia exhibits non-random, history-dependent variation across repeated meals
- Use of Continuous Glucose Monitoring in Non-diabetic Individuals for Cardiovascular Prevention: A Systematic Review of Its Impact on Guiding Lifestyle Interventions
- Dietary Intervention Is Associated with Lower CGM-Derived Glucose Rate-of-Change in Healthy Young Women: A Pilot Fixed Sequential-Intervention Study - PubMed